Watch the Video Tutorial
💡 Pro Tip: After watching the video, continue reading below for detailed step-by-step instructions, code examples, and additional tips that will help you implement this successfully.
Table of Contents
Open Table of Contents
- The Critical Need for Robust Error Handling in n8n
- Understanding the Core Concept
- Required Resources and Cost-Benefit Analysis
- Step-by-Step Implementation Guide
- Critical Best Practices for n8n Error Handling
- Key Takeaways
- Conclusion
- Frequently Asked Questions (FAQ)
- Q: What’s the main benefit of a centralized error workflow?
- Q: My workflow turned red, but I didn’t get a notification. What gives?
- Q: Can I use different notification methods for different types of errors?
- Q: What if the ‘Error Logger’ workflow itself fails?
- Q: How can I test my error handling without breaking my live workflows?
The Critical Need for Robust Error Handling in n8n
So, you’ve built some awesome workflows in n8n, right? They’re like your digital minions, tirelessly working behind the scenes, connecting apps, moving data, and generally making your life easier. But here’s the thing: even the best minions can trip up. Data might be missing, an API might be down, or maybe a service just decides to take a nap. When that happens, if you don’t have a solid error handling plan, it’s like a silent alarm going off that no one hears. You could lose data, miss important tasks, and suddenly, your super-efficient automation becomes a source of headaches.
This guide is all about building a single, powerful error workflow in n8n. Think of it as your central command center for all things gone wrong. It’ll monitor all your active workflows, report back when something breaks, and make sure you’re always in the loop. No more silent failures, no more guessing games. We’re going to make sure you’re always aware and ready to act swiftly.
Understanding the Core Concept
Alright, let’s break down the big idea. Imagine you have a bunch of little robots (your n8n workflows) doing different jobs. Instead of each robot having its own emergency button that only it knows about, we’re going to give them one central emergency button that they all press if they run into trouble. That central button triggers our special “Error Logger” workflow.
This centralized approach is super handy because it means you only set up your error reporting once, and it covers your entire n8n automation ecosystem. When a workflow fails, this system will automatically log all the juicy (or not-so-juicy) error details into a Google Sheet and then ping you with a real-time notification via Slack (or email, if that’s more your jam). This gives you a comprehensive, bird’s-eye view of your workflow’s health. Pretty neat, huh?
Required Resources and Cost-Benefit Analysis
Before we dive into the nitty-gritty, let’s talk about what you’ll need and why this DIY approach is often a winner compared to just buying an off-the-shelf solution. It’s like deciding whether to build your own custom LEGO spaceship or buy a pre-built one. Building it yourself gives you way more control!
Resource Checklist
Here’s a quick rundown of the tools and services we’ll be using. Most of these are either built right into n8n or are super common tools you might already be using:
| Tool/Service | Description | Purpose |
|---|---|---|
| n8n Instance | Self-hosted or Cloud version of n8n | Core automation platform |
| Google Sheets | For logging detailed error information | Centralized error log database |
| Slack/Email | For real-time error notifications | Instant alerts to relevant teams/individuals |
| Error Trigger | n8n built-in node | Initiates the error workflow upon failure |
| Google Sheets Node | n8n built-in node | Appends error data to Google Sheet |
| Slack/Email Node | n8n built-in node | Sends notifications |
Cost-Benefit Analysis: DIY vs. Commercial Solutions
Why go through the trouble of setting this up yourself when there are commercial monitoring services out there? Well, let’s compare. It’s often about control, cost, and how much you want to tailor things to your specific needs.
| Feature/Aspect | DIY n8n Error Handling | Commercial Monitoring Service |
|---|---|---|
| Initial Setup Cost | Low (n8n instance cost + time) | Moderate to High (subscription fees) |
| Ongoing Cost | Low (n8n instance cost + minimal maintenance) | High (recurring subscription fees) |
| Customization | High (fully customizable logging, notifications) | Limited (pre-defined alerts, dashboards) |
| Integration | Seamless with n8n workflows | Requires API integrations, connectors |
| Data Ownership | Full control over your error logs | Data hosted by third-party provider |
| Scalability | Scales with your n8n instance | Depends on service tier |
| Learning Curve | Moderate (familiarity with n8n required) | Low (user-friendly interfaces) |
| Value Proposition | Cost-effective, highly tailored, self-sufficient | Convenience, managed service, less hands-on |
For businesses already rocking an n8n setup, this DIY approach is a no-brainer. You get unparalleled flexibility and save a ton of cash, especially if your error reporting needs are a bit unique. Plus, you own all your data, which is a huge win in my book!
Step-by-Step Implementation Guide
Alright, let’s roll up our sleeves and get this done! I’ll walk you through each step, making sure you know exactly what to do and what to expect.
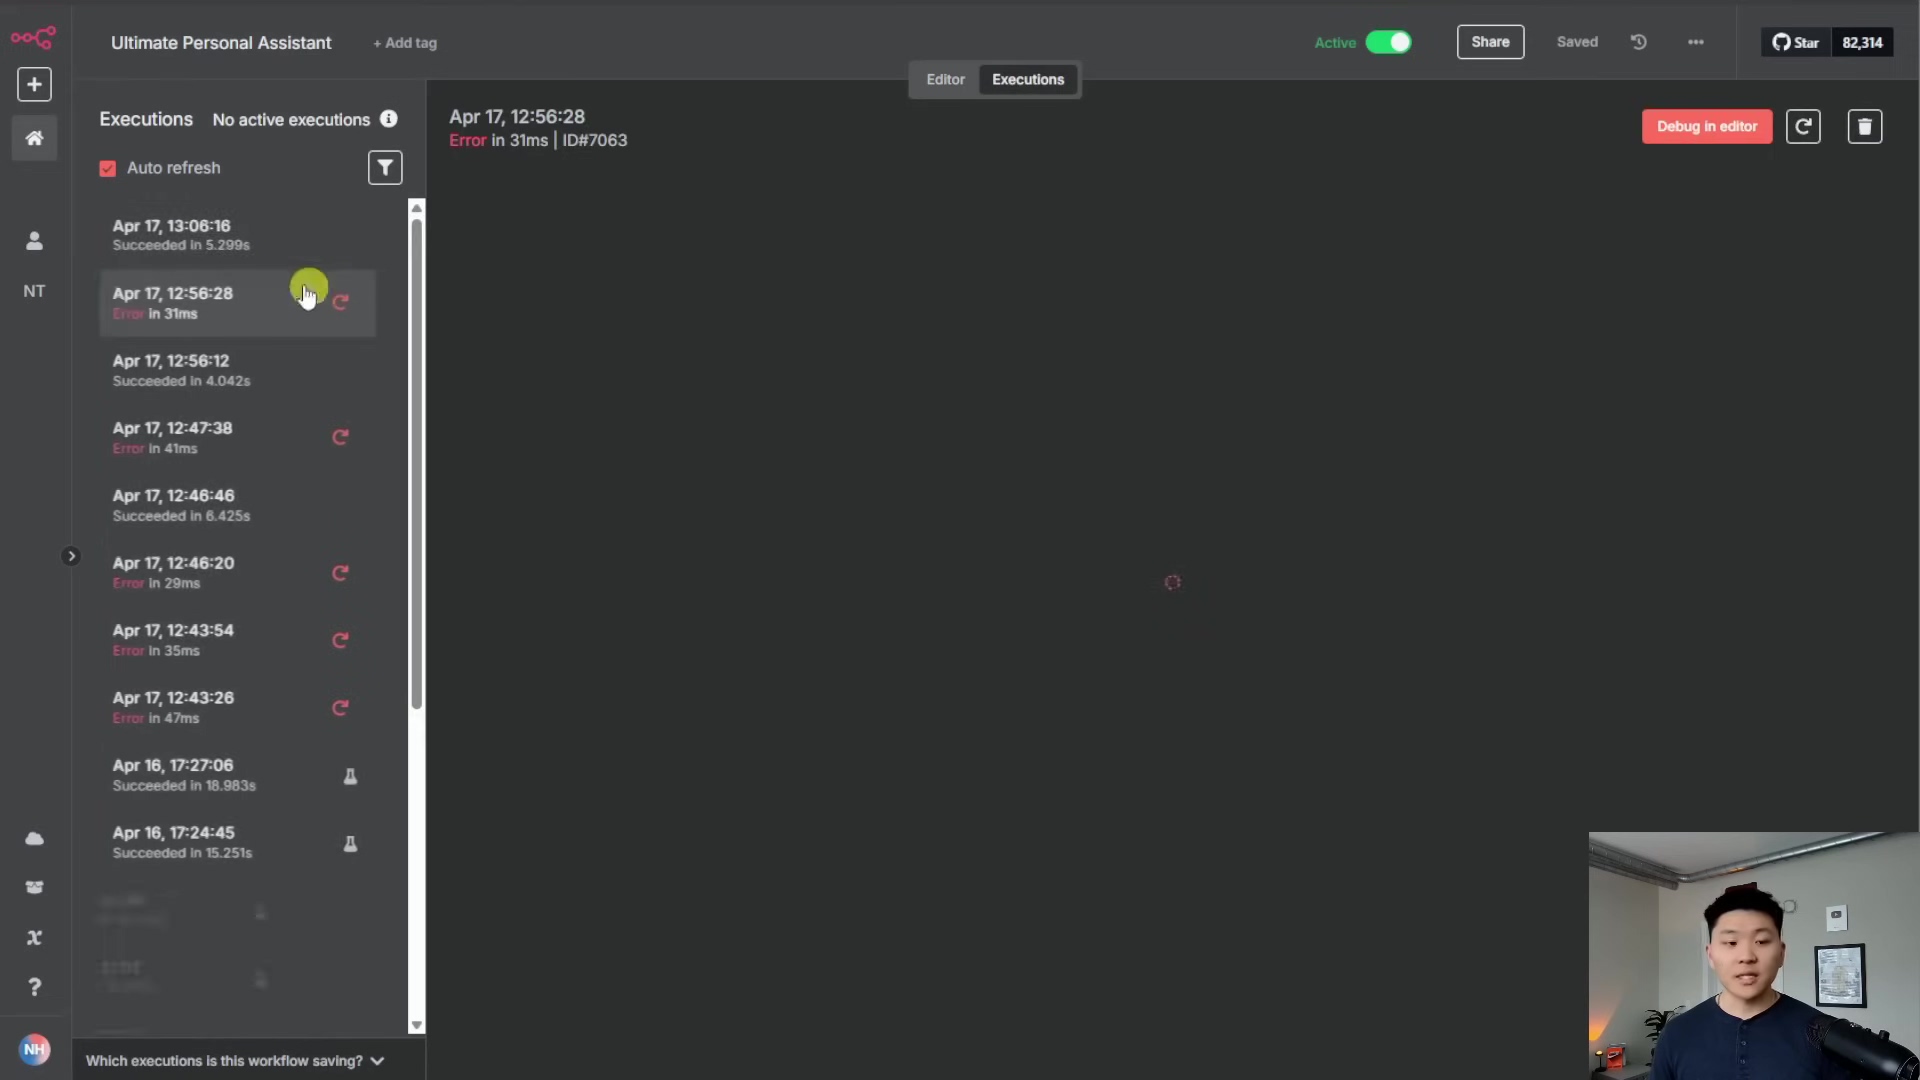
1. Activating Your Main Workflow
First things first: for n8n’s error handling to even know about a problem, the workflow that might have an error needs to be active. Think of it like this: you can’t report a flat tire if your car is still sitting in the garage, right?
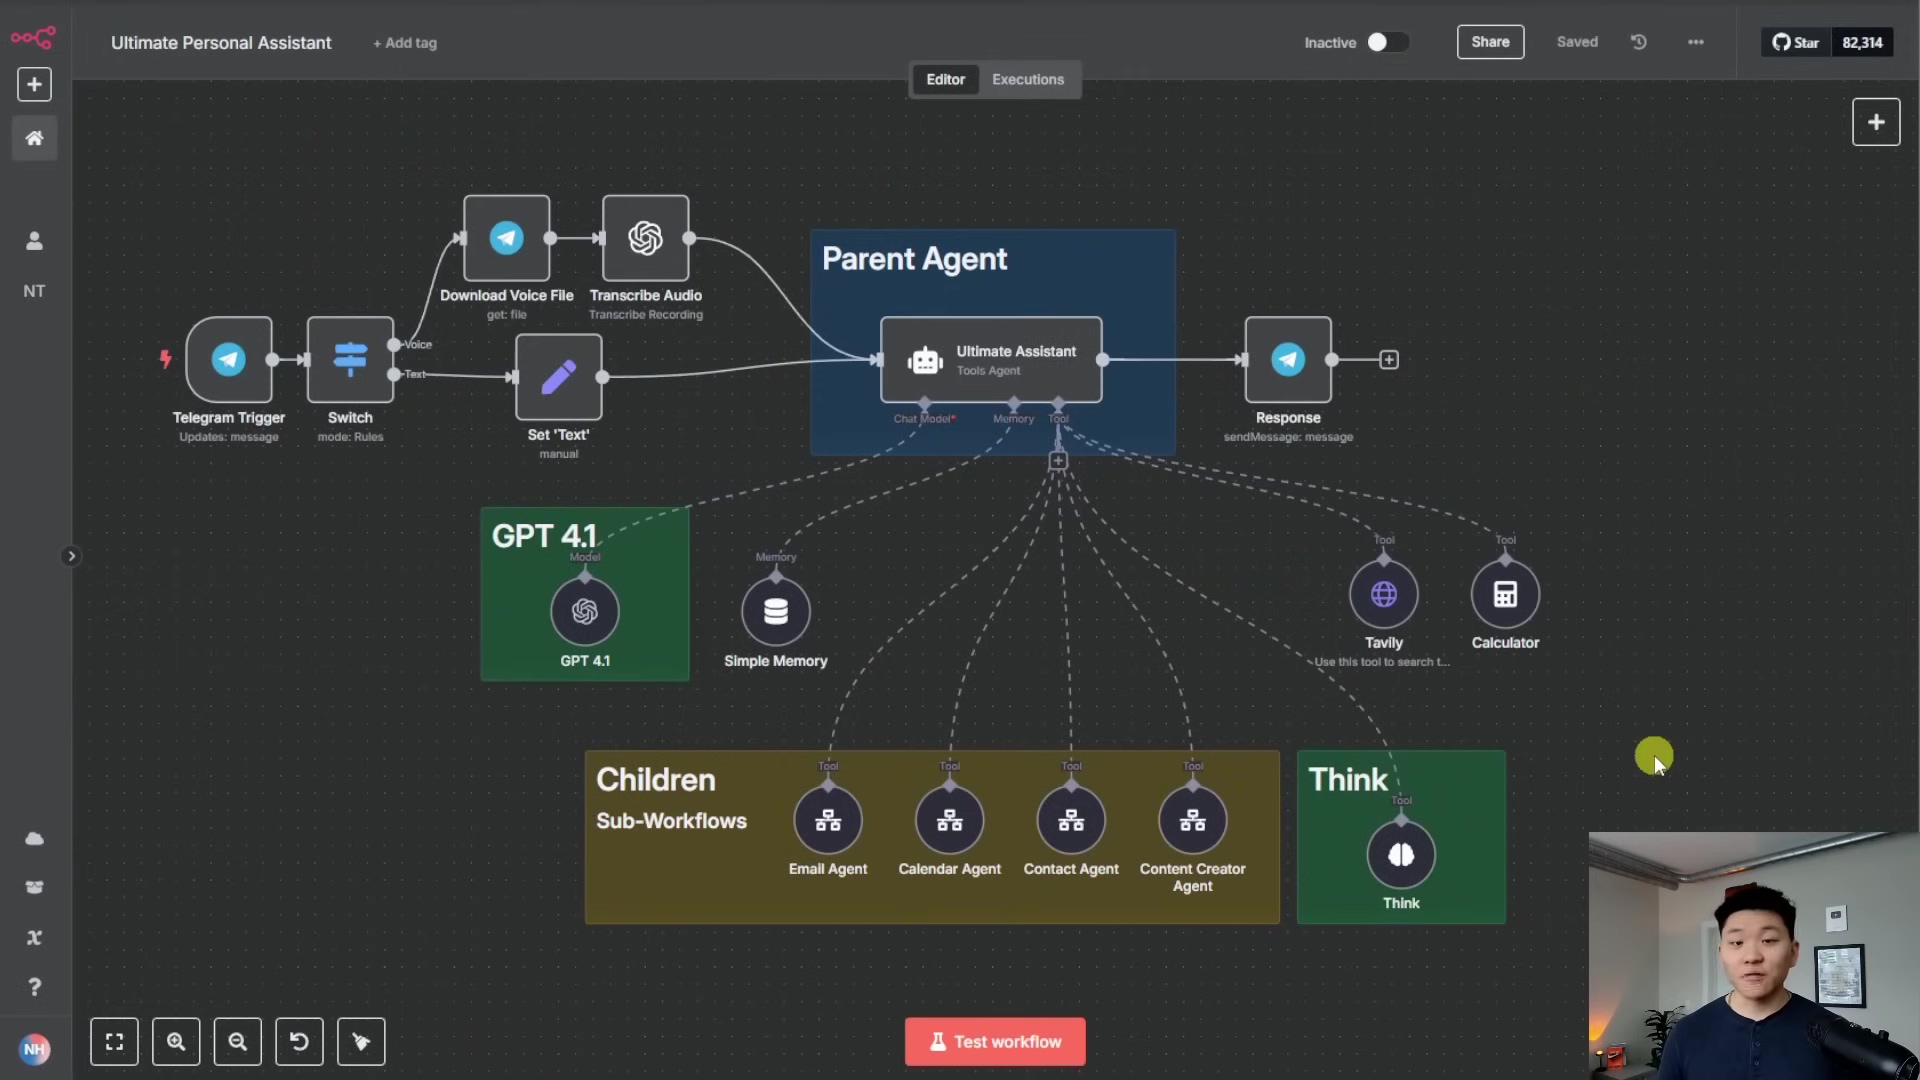
See that little toggle switch? Make sure your primary workflow (like the “Ultimate Personal Assistant” one I’m showing here) is set to ‘Active’. This is super important because it tells n8n, “Hey, this workflow is running, and if it messes up, I want to know about it!” If it’s not active, n8n won’t be listening for its errors.
2. Creating the Central Error Logger Workflow
This is where the magic happens! We’re going to build a brand-new, super-focused workflow whose only job is to catch and process errors from all your other workflows. It’s like setting up a dedicated emergency response team.
Adding the Error Trigger Node
-
Start a new workflow in your n8n instance. You can do this by clicking the ”+ New” button in the top left corner of the n8n interface and selecting “Workflow”.
-
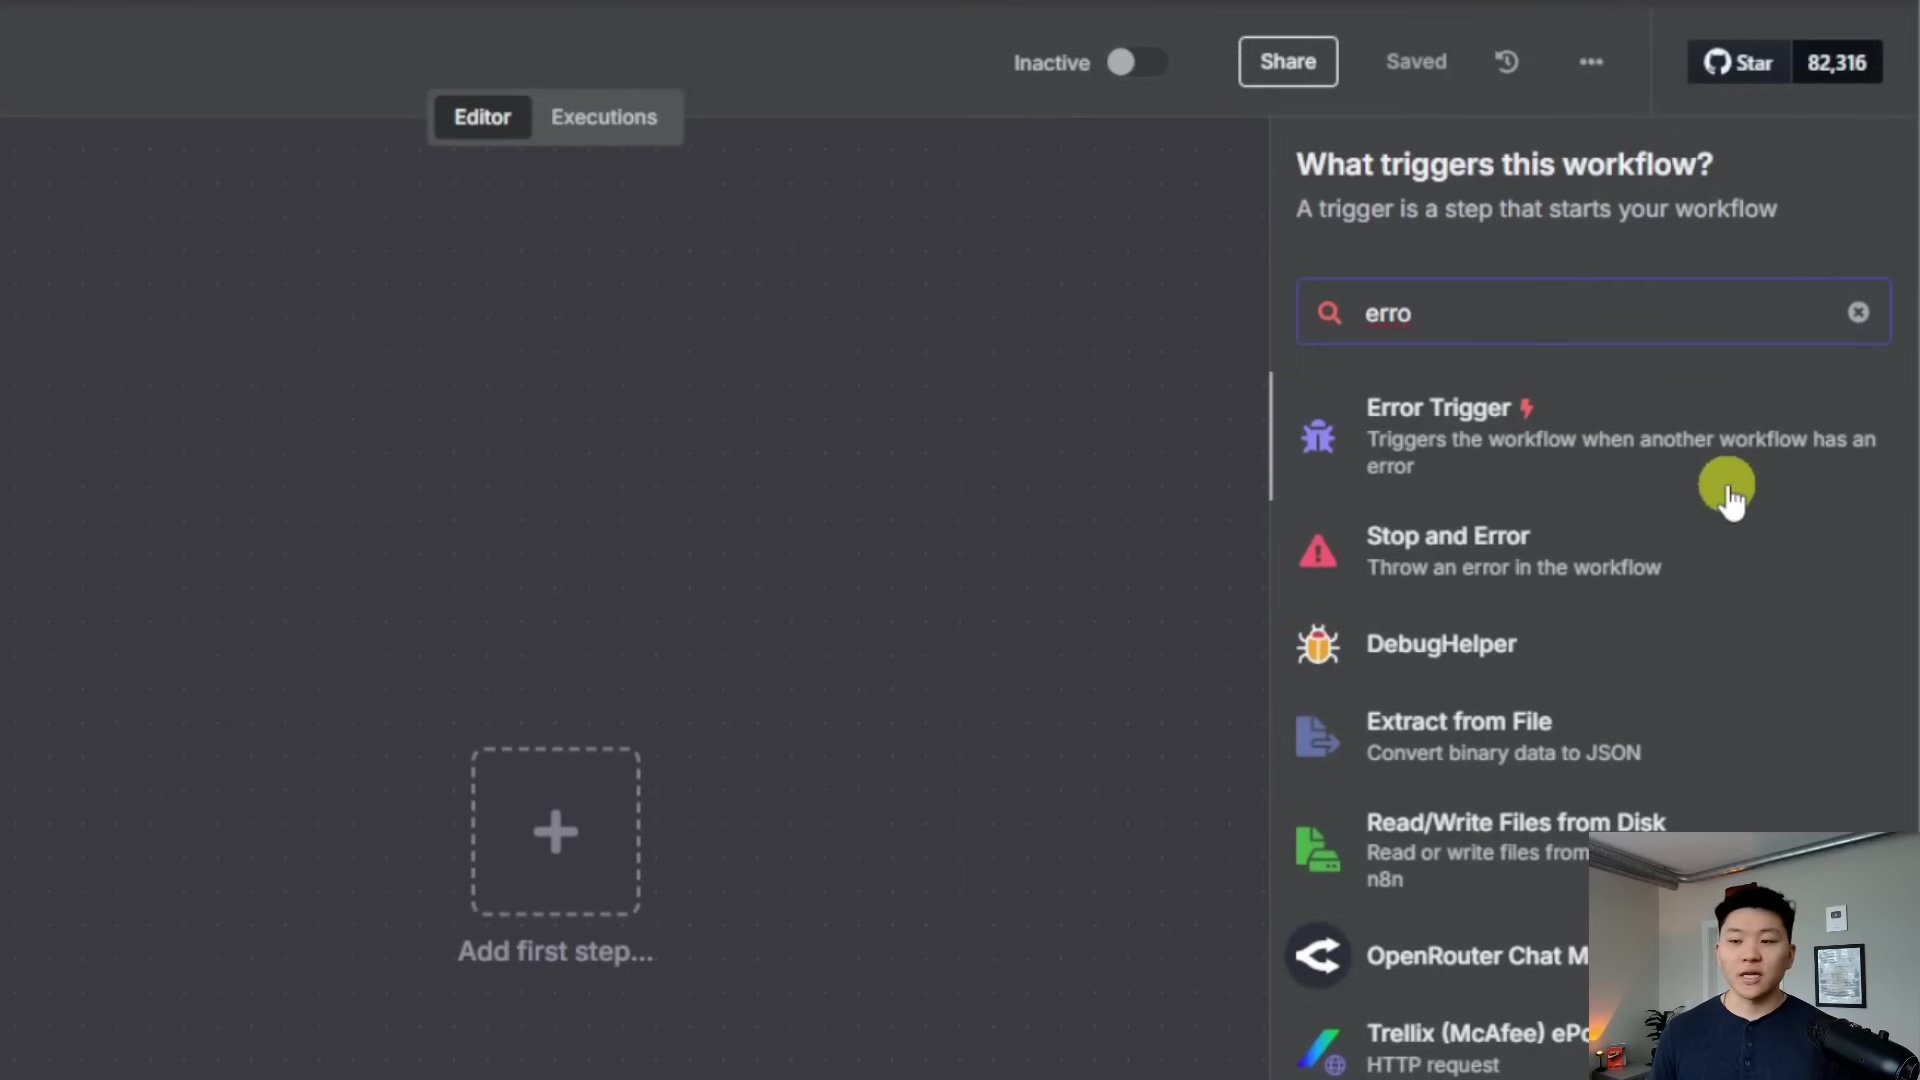
Add an ‘Error Trigger’ node. You can find this by clicking the
+button to add a new node and searching for “Error Trigger”.Error TriggerThis node is pretty special. It’s designed to only activate when another workflow in your n8n instance fails. The best part? You don’t need to configure anything on this node! It automatically listens for errors across your entire n8n setup. How cool is that?
When an error occurs, this ‘Error Trigger’ node will automatically grab all the important details: the ID of the workflow that failed, its name, its URL, the specific node that caused the problem, and, of course, the actual error message. It’s like getting a full incident report automatically!
Linking Workflows to the Error Logger
Now, for your active workflows to actually report their errors to our shiny new ‘Error Logger’, you need to tell them where to send the distress signals. It’s a quick setup for each workflow you want to monitor:
- Go back to one of your active workflows (the ones you want to monitor).
- Click on the workflow settings icon (it usually looks like a gear or a wrench) in the top right corner of the workflow editor.
- Look for the ‘Error Workflow’ option. You’ll see a dropdown menu there.
- From the dropdown, select your newly created ‘Error Logger’ workflow.
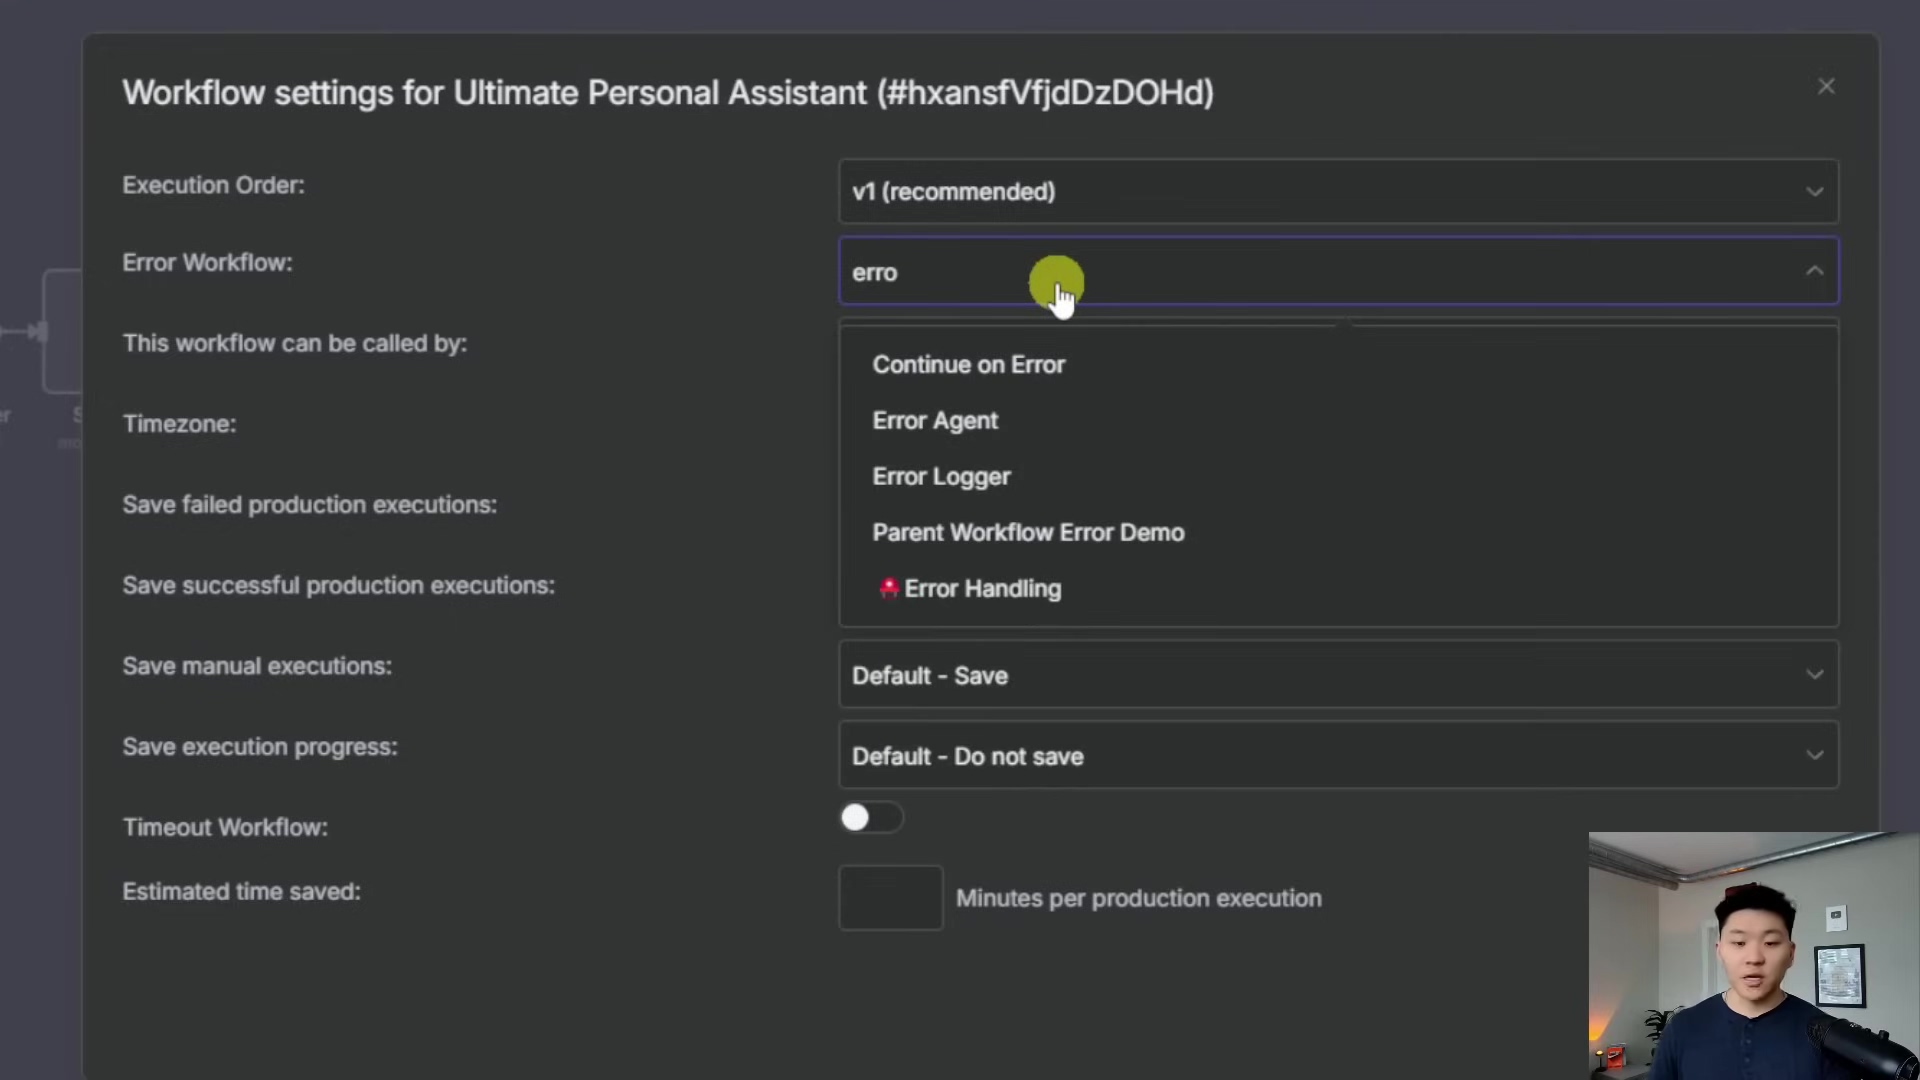
This step is crucial! It creates the connection, ensuring that if anything goes wrong in your “Ultimate Personal Assistant” workflow (or any other workflow you link), it will automatically trigger our ‘Error Logger’. Repeat this for every workflow you want to keep an eye on. It’s a one-time setup per workflow, and then you’re golden.
3. Logging Errors to Google Sheets
Having a real-time alert is great, but what about keeping a historical record? That’s where Google Sheets comes in! We’ll use it to log every single error, giving you a searchable database for tracking, analysis, and debugging over time. It’s like having a digital diary of all your workflow mishaps, which is super helpful for figuring out patterns and preventing future issues.
Configuring the Google Sheets Node
-
In your ‘Error Logger’ workflow, add a ‘Google Sheets’ node right after the ‘Error Trigger’ node. Make sure they’re connected.
-
In the Google Sheets node’s configuration, set the Operation to ‘Append a row’. This means every time an error comes in, it’ll add a new line to your sheet.
-
You’ll need to authenticate your Google Sheets account with n8n if you haven’t already. Just follow the prompts; it’s usually a few clicks to grant access.
-
Select the specific Google Sheet you want to use for your error logs. I recommend creating a new, dedicated sheet for this, maybe called “n8n Error Logs”.
-
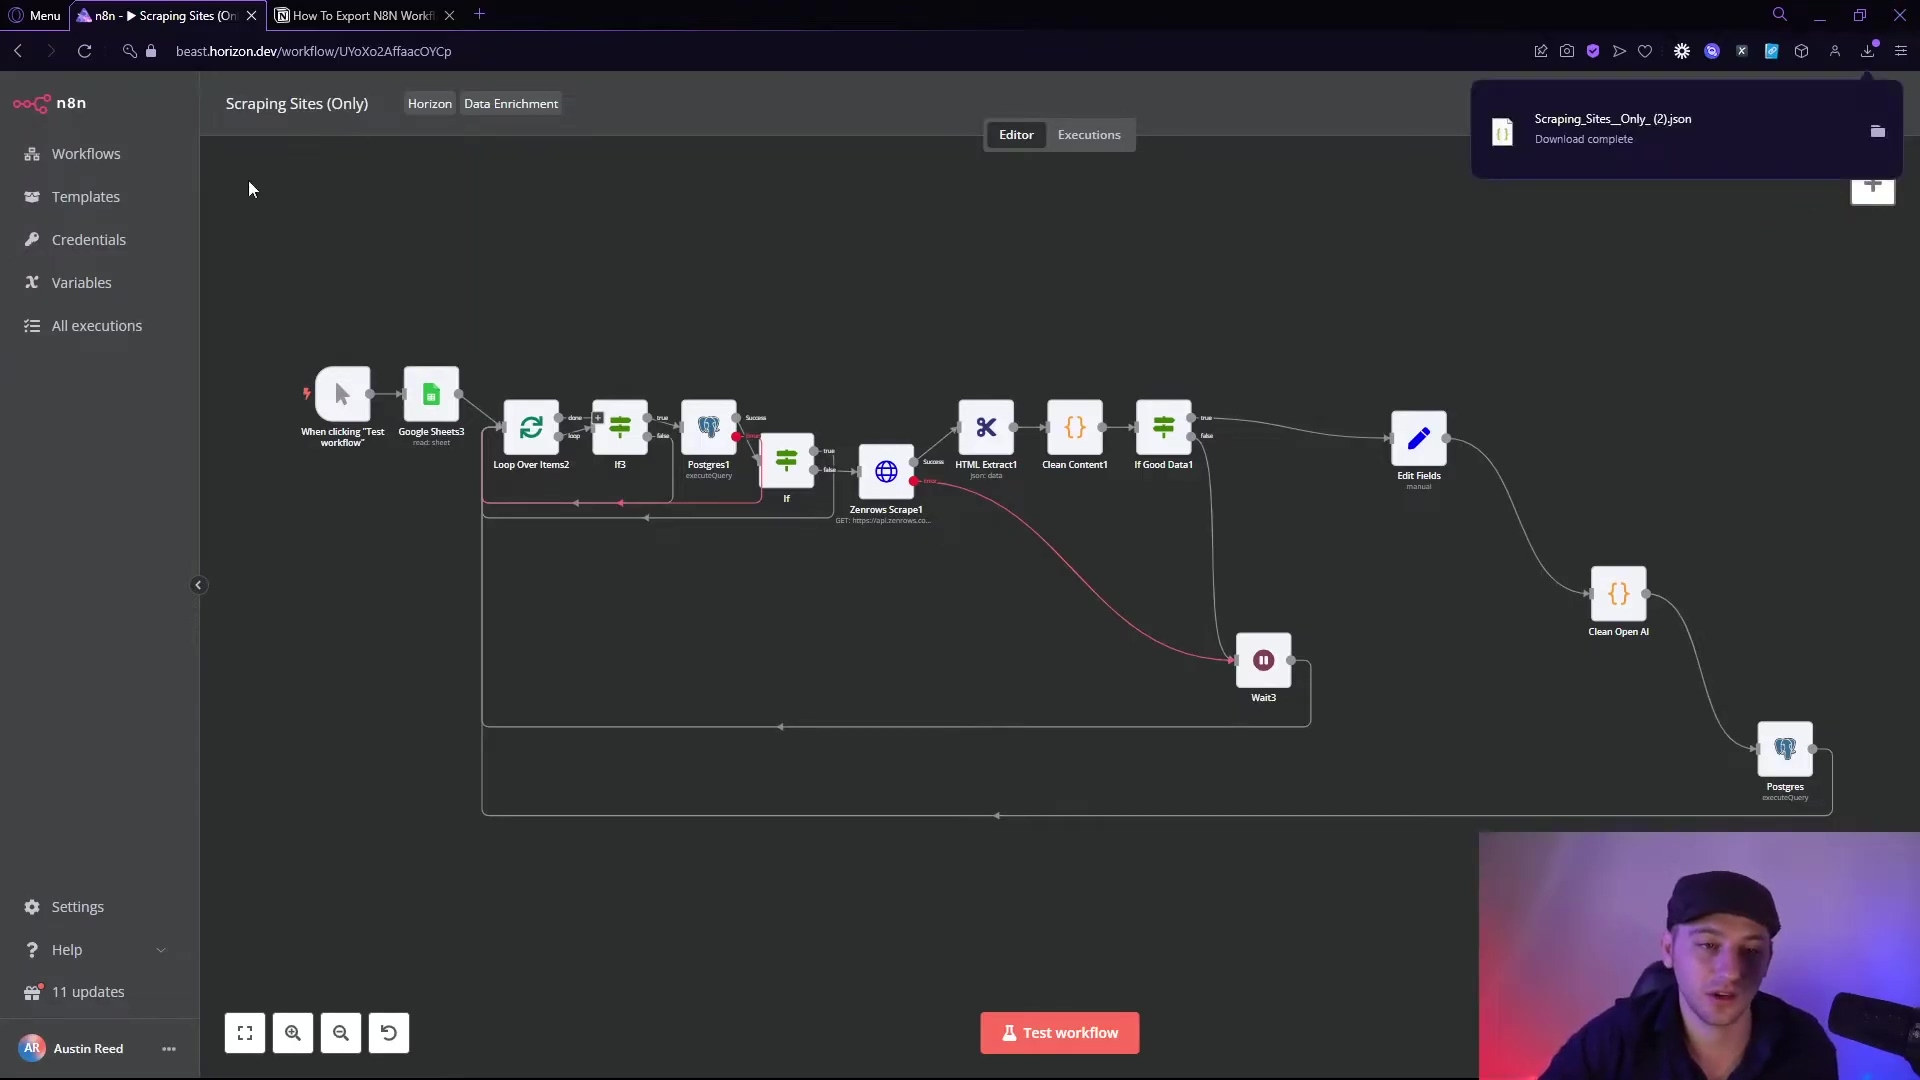
Now, let’s map the incoming error data to specific columns in your sheet. This is where we tell n8n which piece of error info goes into which column. You’ll use n8n’s expression builder for this. Here’s what you’ll map:
- Timestamp: Use the expression
{{ $now }}. This is a built-in n8n function that grabs the exact current date and time when the error occurred. Super handy for knowing when things went wrong. - Workflow Name: Map this to the workflow’s name from the error trigger’s output. You’ll typically find this under something like
{{ $json.workflow.name }}. - Workflow URL: Map this to the URL of the failing workflow’s execution. This is usually
{{ $json.execution.url }}. This link is a lifesaver because it takes you directly to the failed execution in n8n, so you can inspect it immediately. - Node: Map this to the name of the node that actually caused the error. Look for something like
{{ $json.node.name }}. - Error Message: Map this to the detailed error message itself. This is often
{{ $json.error.message }}.
![The image displays a section of the n8n workflow editor, focusing on configuring a 'Timestamp' field within a node. The left side of the screen shows a partial view of a workflow structure, including elements like 'Error', 'ID', 'URL', 'Name', 'Message', and 'false'. The main right panel is a configuration interface for a 'Timestamp' field. It has an input box with '{{ $now }}' pre-filled, indicating a dynamic value for the current time. Below the input, a 'Result' field shows '[DateTime: 2025-04-17T12:59:09.545-06:00]', which is a preview of the timestamp. A 'Tip' is provided for data transformation options. Further down, there are sections for 'URL', 'Node', and 'Error Message', each with a checkbox and an 'Add column to send' button. The bottom of the panel shows 'Options' and 'No properties'. A person is visible in the bottom right corner of the screen, looking at the interface.](https://imghub.did.fm/6a45e638e1825e33131545a5dfda796b.jpg)
- Timestamp: Use the expression
This setup ensures that every single error is neatly logged, giving you a clear, searchable record of all incidents. After you’ve configured it, you can run a quick test (we’ll cover how to intentionally cause an error soon!) and then check your Google Sheet. You should see a new row populated with all the error details. Nailed it!
4. Real-time Error Notifications (Slack/Email)
Logging errors is fantastic for historical tracking, but what about knowing right now when something breaks? That’s where real-time notifications come in! We’ll set up a Slack or Email node to instantly ping your team (or just you!) whenever a workflow throws a tantrum.
Configuring the Notification Node
-
Add either a ‘Slack’ node or an ‘Email’ node to your ‘Error Logger’ workflow. Connect it to the ‘Error Trigger’ node, just like you did with the Google Sheets node. You can even have both if you want!
-
Again, you’ll need to authenticate your Slack or Email account with n8n. Follow the prompts for whichever service you choose.
-
Now, let’s craft the message content. This is what your team will see, so make it clear and actionable! You’ll use expressions again to pull in the error details. Here are some good ones to include:
- Workflow Name: Something like
Workflow Error: {{ $json.workflow.name }}. This immediately tells you which workflow failed. - Node Error:
Node: {{ $json.node.name }} erred at {{ $now }}. This tells you which specific part of the workflow broke and when. - Error Message:
Error Message: {{ $json.error.message }}. This is the actual technical error message, super helpful for debugging. - Execution Link:
See this execution here: {{ $json.execution.url }}. This is perhaps the most valuable piece of information! Clicking this link will take you directly to the failed execution in n8n, where you can inspect all the data and figure out what went wrong.
- Workflow Name: Something like
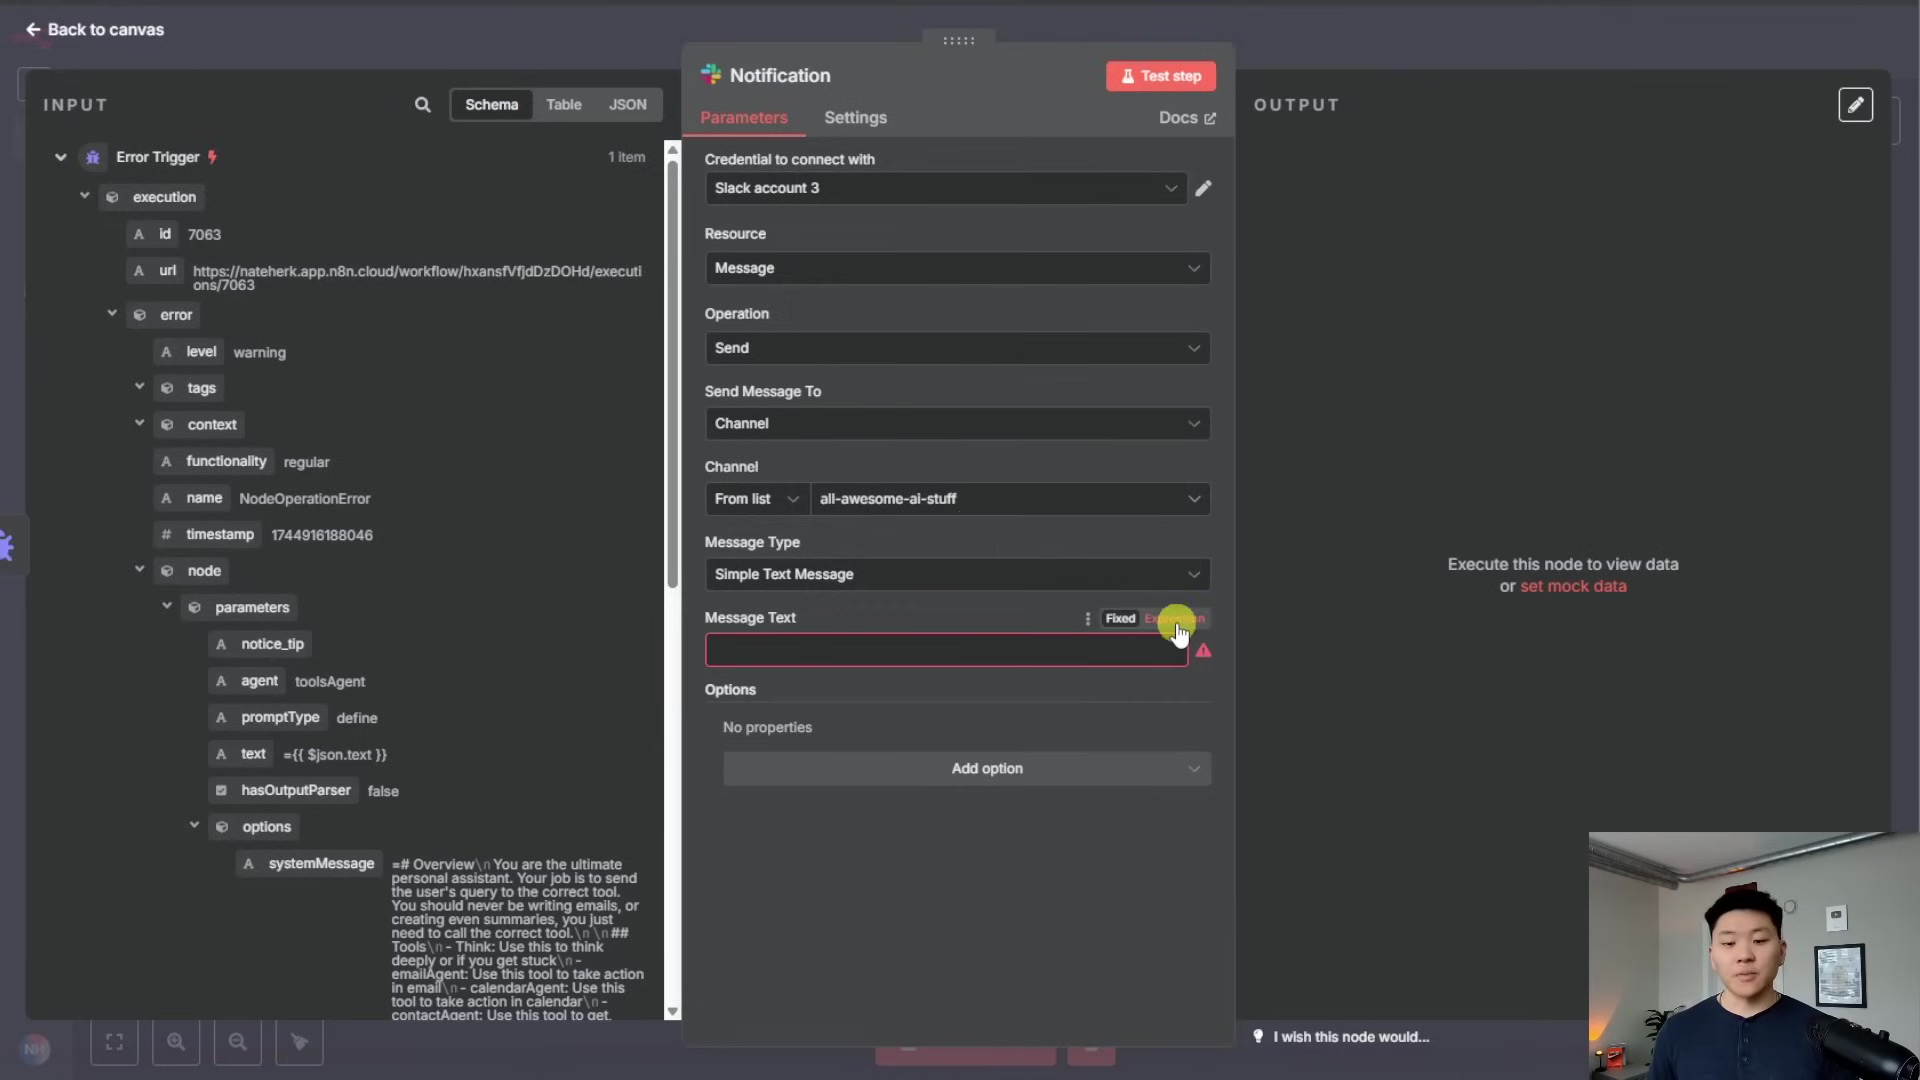
Pro Tip: If you’re using the Slack node, you might want to disable the ‘Include link to workflow’ option. Why? Because we’re already including the {{ $json.execution.url }} in our custom message, and having two links can look a bit redundant. This keeps your alerts clean and to the point. With this setup, your team gets concise, actionable alerts right where they need them, whether it’s in a Slack channel or their inbox. No more missed errors!
5. Verifying Error Logging and Notifications
Alright, we’ve built it, now let’s test it! The best way to confirm your error handling system is working perfectly is to intentionally cause an error in one of your linked workflows. Don’t worry, it’s for science!
How to intentionally cause an error (the easy way):
- Go to one of the workflows you’ve linked to your ‘Error Logger’.
- Find a node that interacts with an external service (like a Google Sheets node, a Slack node, or an HTTP Request node).
- Temporarily change something in its configuration to make it fail. For example, if it’s a Google Sheets node, change the spreadsheet ID to something random that doesn’t exist. If it’s an HTTP Request, change the URL to a non-existent one.
- Save and activate that workflow.
- Manually execute the workflow (or wait for its next scheduled run if it’s a scheduled workflow).
What should happen next?
- Your main workflow should turn red and fail (that’s the intentional error).
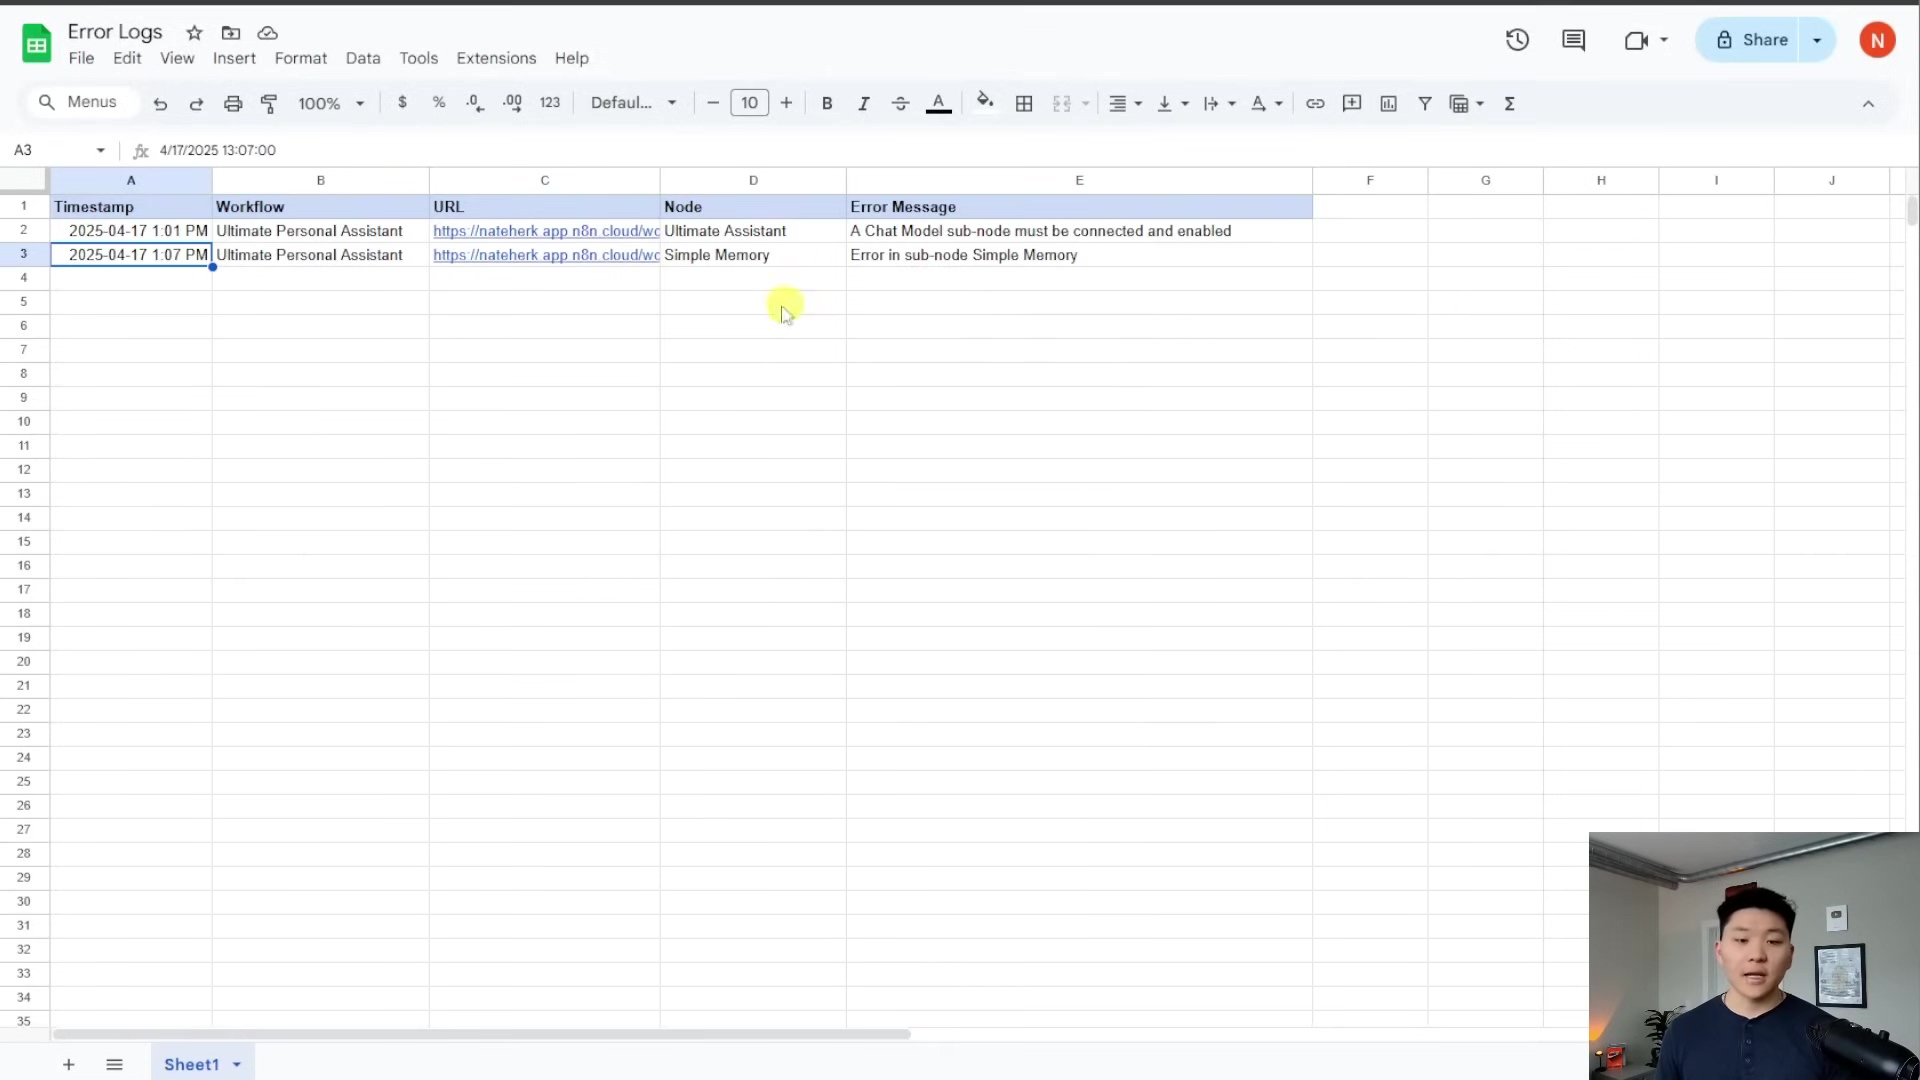
- Almost immediately, you should see a new entry pop up in your Google Sheet with all the error details.
- You should also receive a notification in Slack (or email) with the error message and, crucially, that direct link to the failed execution in n8n.
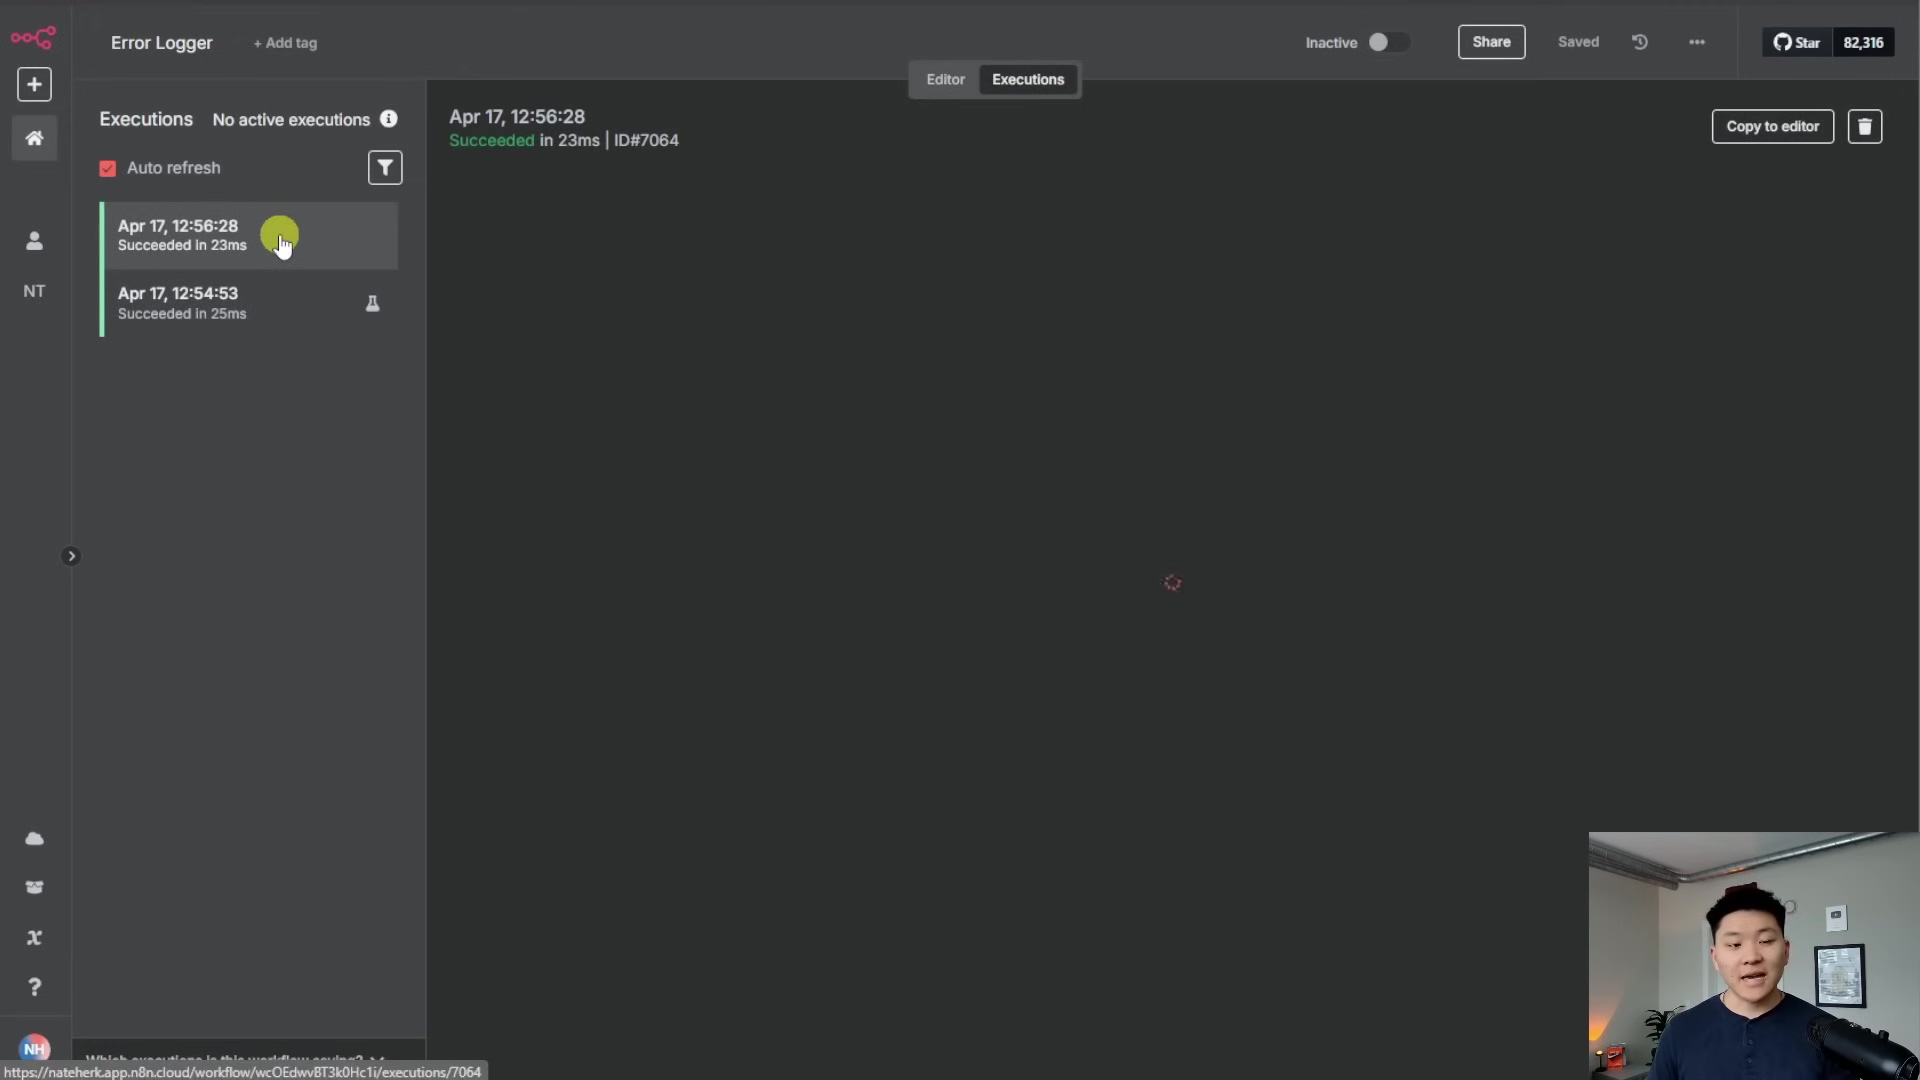
To double-check everything on the n8n side, navigate to the ‘Executions’ tab of your ‘Error Logger’ workflow. You should see a successful execution there. This confirms that the error was caught by the ‘Error Trigger’ and processed by the subsequent nodes (Google Sheets and Slack/Email).
Click on that successful execution in the ‘Error Logger’ to review the execution details. You can see exactly what data was passed through each node, confirming that all the error information was correctly captured and sent out. This comprehensive setup ensures you have both a real-time alerting system and a robust historical log for all your n8n workflow errors. You’re basically an error-handling superhero now!
Critical Best Practices for n8n Error Handling
Okay, before we wrap up, a few words of wisdom from someone who’s seen a few workflows go sideways. These are crucial tips to keep your error handling system as robust as possible.
⚠️ Distinguish Between Errors and Non-Working Tools: This is a big one! It’s super important to understand the difference between a workflow that “errors out” (meaning it turns red and completely stops) and a node that just doesn’t work as expected but allows the workflow to continue (it stays green, but maybe the data isn’t right). Our ‘Error Trigger’ workflow only catches the first type – the hard stops. For the second type, where a node might return an empty result or unexpected data but doesn’t technically “error,” you’ll need to build custom checks within your main workflow. Think ‘IF’ nodes to check for empty data or ‘Try/Catch’ blocks around specific nodes to handle expected failures gracefully without stopping the whole workflow. This is a more advanced topic, but something to keep in mind as you get more comfortable.
💡 Keep the Error Logger Simple: Seriously, resist the urge to add complex logic to your ‘Error Logger’ workflow. Its job is to catch, log, and notify. That’s it. The simpler it is, the less likely it is to fail. You don’t want your error logger having errors, right? That’s like the fire department catching fire!
⚠️ Authentication is Key: I can’t stress this enough. So many workflow issues, especially those that cause hard errors, come down to authentication problems. API keys expiring, passwords changing, permissions getting revoked – it happens! Make it a habit to regularly verify the credentials for all your nodes. A quick check can prevent a lot of headaches and unnecessary error alerts.
Key Takeaways
Let’s quickly recap the awesomeness we just built:
- Centralized Error Management: You now have one single ‘Error Logger’ workflow that can keep an eye on all your active n8n workflows. Efficiency at its best!
- Proactive Notification: Get instant alerts via Slack or email the moment a workflow decides to take an unexpected nap. No more silent failures!
- Detailed Logging: Automatically log every little error detail (timestamp, workflow name, URL, the problematic node, and the error message) to Google Sheets. This is your historical record, your debugging bible.
- Simplicity is Strength: We designed our error logger to be lean and focused, ensuring it’s super reliable and doesn’t become a source of errors itself.
- Error vs. Non-Functionality: You now understand the crucial difference between a workflow that completely halts due to an error and a tool that just doesn’t perform as expected. This knowledge is power for more advanced error handling.
Conclusion
Implementing a centralized error handling system in n8n isn’t just a good idea; it’s a game-changer for maintaining the reliability and efficiency of your automated processes. By following these steps, you’ve significantly reduced potential downtime, improved your response times to issues, and gained invaluable insights into the overall health of your n8n workflows. This robust setup means that even when things inevitably go wrong (because, let’s be real, they sometimes do!), you’ll be immediately informed and equipped with all the data you need to resolve problems swiftly.
Now, go forth and apply these powerful error handling techniques to your own n8n instances! And hey, if you discover any additional tips or have cool experiences to share, drop them in the comments below. We’re all in this automation journey together!
Frequently Asked Questions (FAQ)
Q: What’s the main benefit of a centralized error workflow?
A: The biggest benefit is efficiency and consistency! Instead of setting up error handling for each individual workflow, you configure it once in a dedicated “Error Logger” workflow. This saves time, reduces complexity, and ensures all your errors are reported and logged in a uniform way. It’s like having one central alarm system for your entire house instead of a separate one for each room.
Q: My workflow turned red, but I didn’t get a notification. What gives?
A: Ah, good question! First, double-check that you’ve correctly linked your main workflow to the ‘Error Logger’ workflow in its settings (Step 2, “Linking Workflows”). If that’s set up, make sure your ‘Error Logger’ workflow itself is active. Also, verify the authentication for your Google Sheets, Slack, or Email nodes within the ‘Error Logger’ – sometimes credentials expire or permissions change. Finally, check the ‘Executions’ tab of your ‘Error Logger’ workflow to see if it even triggered. If it didn’t, the link might be broken.
Q: Can I use different notification methods for different types of errors?
A: Absolutely! While this guide focuses on a single notification method (Slack/Email), you can expand your ‘Error Logger’ workflow. For example, you could add an ‘IF’ node after the ‘Error Trigger’ to check for specific error messages or workflow names, and then send different notifications (e.g., a critical error to a specific Slack channel, a minor error to an email address). The possibilities are endless with n8n’s flexibility!
Q: What if the ‘Error Logger’ workflow itself fails?
A: That’s the nightmare scenario, right? Like the fire station catching fire! This is why we emphasize keeping the ‘Error Logger’ workflow as simple as possible (see “Keep the Error Logger Simple” in Best Practices). It should only contain the ‘Error Trigger’ and the logging/notification nodes. The fewer nodes and less complex logic it has, the more reliable it will be. If it does fail, you’d have to manually check n8n’s system logs, but it’s a rare occurrence if kept simple.
Q: How can I test my error handling without breaking my live workflows?
A: Great question! The best way is to create a copy of one of your live workflows, or a simple test workflow, and link that copy to your ‘Error Logger’. Then, intentionally cause an error in that test workflow (e.g., by providing invalid credentials or a non-existent URL to a node). This allows you to verify your error handling setup without impacting your production automations. Once you’re confident, you can link your actual live workflows.